
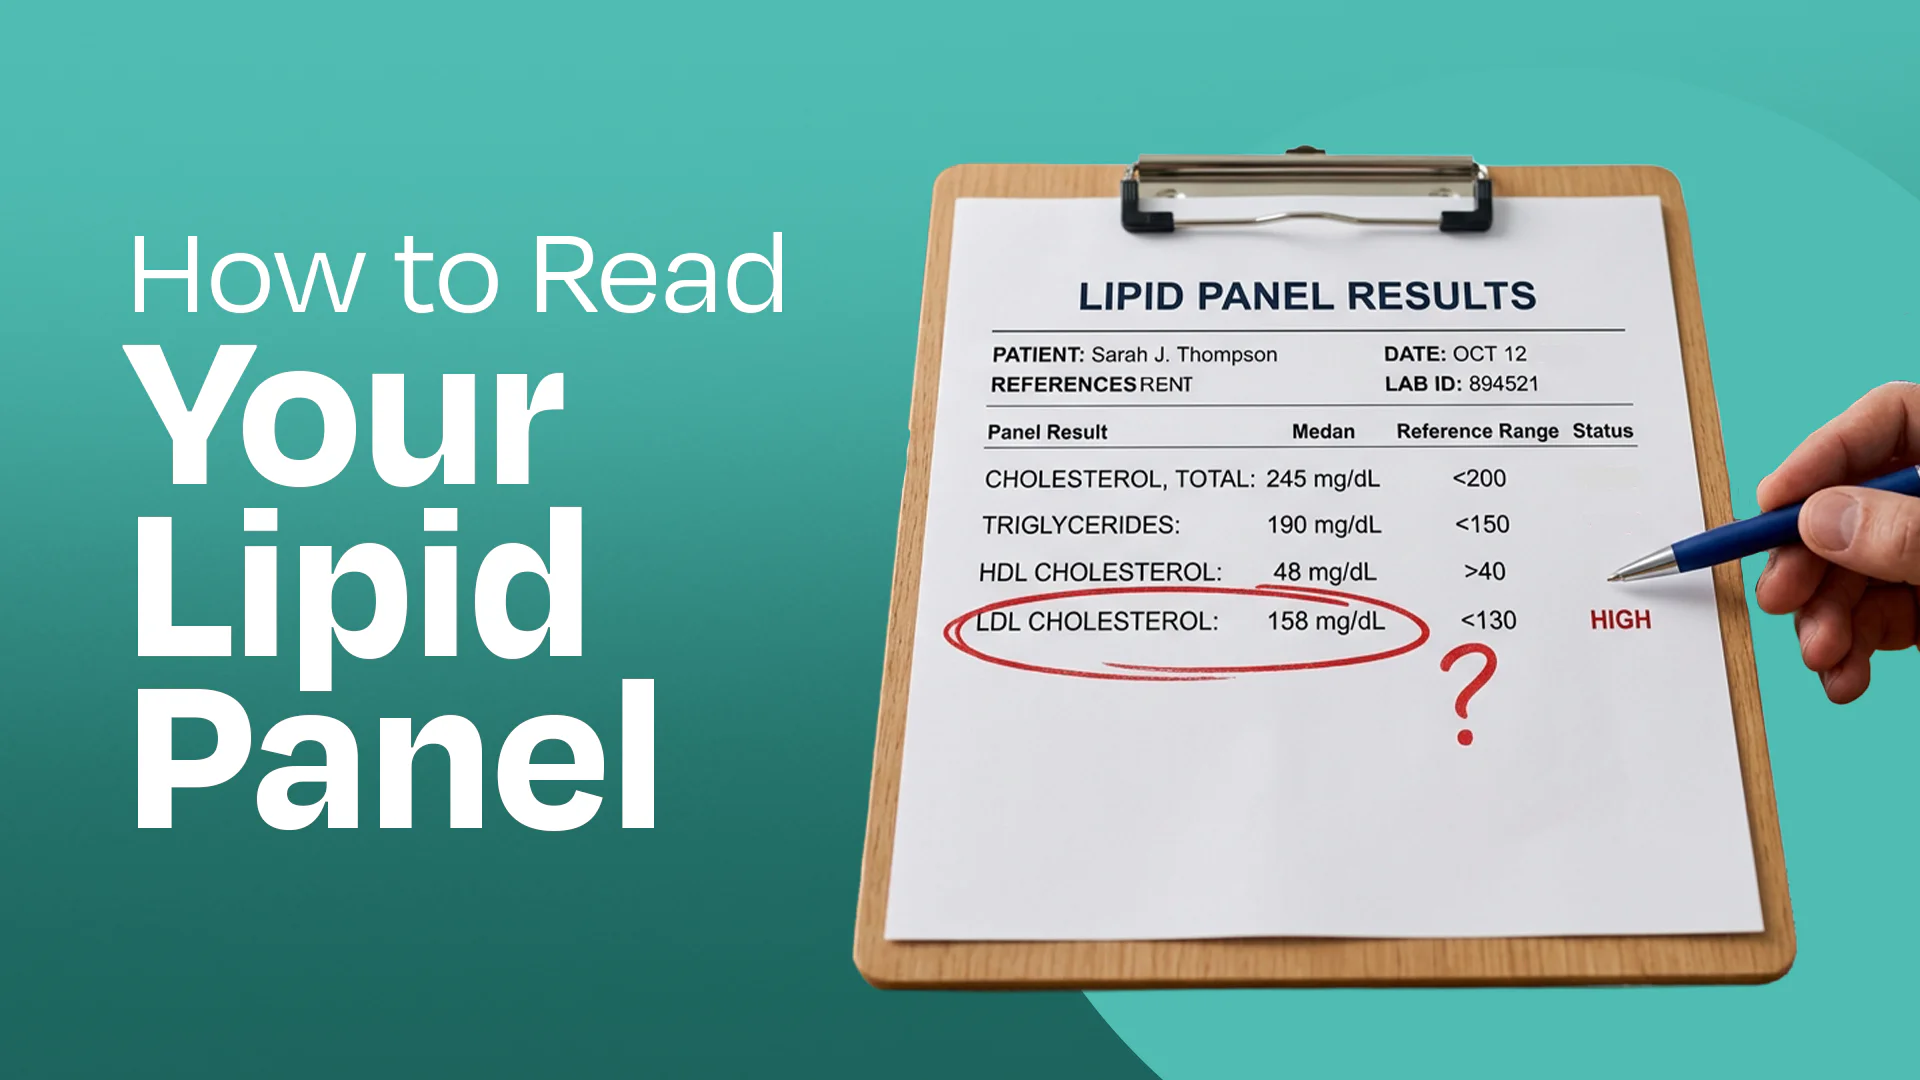
You open your latest lab results and see your LDL highlighted in red. Your stomach drops.
You haven’t even met with your doctor yet to go over the results but you know enough to understand this isn’t a good sign. You think to yourself, “does this mean I’m at a high risk for heart disease?”
Cardiologist and lipidologist Dr. Bret Scher has seen this situation many times. And the answer usually requires looking beyond that single red number on your lab report.
So, what does your LDL tell you? What else matters when evaluating cardiovascular risk? And what should you consider discussing with your care team before deciding what comes next?
Let’s start with what’s actually on your lipid panel.
Breaking Down a Standard Lipid Panel
A standard lipid panel usually includes LDL cholesterol, HDL cholesterol, triglycerides, total cholesterol, and non-HDL cholesterol.
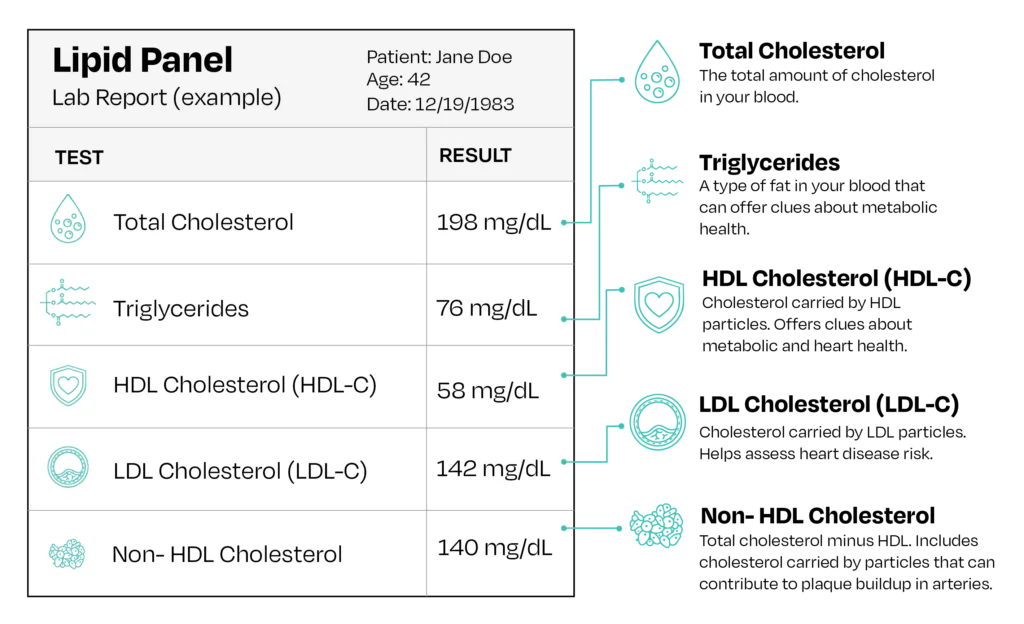
You’ll get more out of the panel by looking at how those numbers fit together instead of zeroing in on LDL.
Start by Looking Beyond L DL
Some lab values have thresholds that apply to nearly everyone. Potassium is one example: below a certain level, the risk of serious heart rhythm problems rises regardless of your family history or metabolic health. Hematocrit works in a similar way, with a fairly universal point below which oxygen delivery in the blood becomes impaired.
LDL is different. Higher LDL cholesterol is associated with cardiovascular disease, but the number by itself is not a direct measure of disease in your arteries, nor does it capture everything that contributes to your cardiovascular risk.
Large studies have found that LDL-C can sometimes underestimate or overestimate coronary risk when it doesn’t align with other measures of lipoproteins, such as particle burden, involved in atherosclerosis. More recent reviews have reached a similar conclusion, finding that other lipid markers can add meaningful risk information that LDL-C alone may miss[*][*].
That’s why Dr. Scher doesn’t read LDL in isolation. He recognizes its role in the atherosclerotic process, while also looking at the person behind the number.
Take an LDL of 130 mg/dL, for example. A healthy 32-year-old with no family history of cardiovascular disease and a 72-year-old with two cardiac stents could have the exact same result, yet their overall cardiovascular risk would be very different.
A very high LDL level does raise another set of questions. Current guidelines consider levels above 190 mg/dL high risk, in part because results in this range can be associated with familial hypercholesterolemia, or FH, an inherited condition linked to earlier cardiovascular disease. Dr. Scher cautions against jumping straight from “LDL over 190” to “you have FH,” though. A clinician still needs to look at family history and the rest of the clinical picture before making that diagnosis.
Examine What Triglycerides and HDL Add
If LDL doesn’t tell you everything you need to know about heart disease risk, then what else should you and your doctor be looking at?
Often times, patients feel like other numbers on their lipid panel, like triglycerides and HDL cholesterol are brushed over, but these numbers are critical and can paint a more complete picture.
Triglycerides, or the fat circulating in your blood, can tell a lot about your overall metabolic health and risk of cardiovascular disease.
Most lab reports call triglycerides under 150 mg/dL normal. In his clinical practice, Dr. Scher aims lower with the people he treats:
“I’d say 150 is “normal” for a metabolically unhealthy population, but in my patients, I want to see triglycerides under 100. I know that’s aggressive, but I think it’s important.” —Dr. Bret Scher
Looking at HDL adds another piece to the metabolic picture. Dr. Scher describes low HDL as a very reliable marker of metabolic dysfunction that tracks with higher cardiovascular risk. In the early Framingham data, low HDL was a better predictor of heart disease than elevated LDL. The general cutoffs he references are 40 mg/dL for men and 50 mg/dL for women.
But what he really wants to know is why the HDL looks the way it does. If it rises while triglycerides fall, visceral fat decreases, diet improves, exercise increases, and metabolic health improves, then that change is part of a broader pattern. In his words, a rising HDL in that context signals that the underlying problem is getting better, and that will absolutely reduce cardiac risk.
This is also why simply pushing HDL higher doesn’t tell you much on its own. Some drugs have raised HDL without reducing cardiovascular events, so a higher number by itself doesn’t automatically translate into lower risk.
At the same time, a very high HDL isn’t always protective. In some people, it’s driven by genetics and may function differently. As with the rest of your markers, HDL is most useful when read alongside the broader metabolic picture, not as a standalone score.
But, according to Dr. Scher, it’s the relationship between the two numbers that matters to him even more than each on their own:
“Even more than the raw number, I care about the triglyceride-to-HDL ratio. I like it under 1.5, and again, that’s aggressive according to published studies. Most published insulin-resistant cutoffs sit between, like, 2 and 3, but I’m not trying to optimize for average.” —Dr. Bret Scher
These are the benchmarks he works toward with his own patients rather than targets that apply to the general population. He also notes that the ratio doesn’t behave the same way across all populations. Black patients tend to have lower triglycerides at the same degree of insulin resistance, so the cutoff may need to be interpreted differently. That’s part of why he treats these numbers as context for a conversation instead of absolute cutoffs.
Consider ApoB and Lp(a)
Getting a fuller picture of cardiovascular risk may require looking beyond the standard lipid panel. Two additional markers Dr. Scher often discusses are lipoprotein(a), or Lp(a), and ApoB.
Because Lp(a) is largely determined by genetics, it usually changes little with diet or lifestyle in the general population. The 2026 guidelines recommend that every adult have Lp(a) measured at least once in their lifetime. This can identify a genetic risk factor that may otherwise go unnoticed.
ApoB offers a closer estimate of how many potentially atherogenic particles are circulating in your blood. Each of these particles carries one ApoB molecule, while LDL-C measures the amount of cholesterol carried inside LDL particles.
Think of LDL particles as cars carrying cholesterol as passengers. LDL-C tells you how many passengers are on the road, while ApoB tells you how many cars there are. Two people can have the same LDL-C but different numbers of particles carrying that cholesterol. ApoB can add context when LDL-C and the broader metabolic picture doesn’t seem to tell the same story.
Researchers have seen this mismatch in long-term data. In a study of more than 27,000 women followed for a median of 17 years, LDL-C underestimated coronary risk when ApoB particle burden was higher than expected and overestimated risk when it was lower (*).
A 2025 systematic review involving more than 593,000 participants reported that ApoB was the more accurate marker of atherosclerotic cardiovascular risk in all nine studies that directly compared it with LDL-C (*).
ApoB adds useful context, and it remains one part of a broader cardiovascular assessment. It’s one test Dr. Scher feels should be used more, and he often encourages people to check it alongside the standard lipid profile.
Watch this video to learn more about ApoB and its place in cardiovascular risk assessment
Don’t Lose Sight of Metabolic Health
For people using ketogenic therapy, a rise in LDL may occur alongside improvements in other markers of metabolic health. Triglycerides may fall, blood glucose and insulin resistance may improve, and visceral fat may decrease. Dr. Scher looks at these changes together to understand the broader health picture, including what the LDL increase may mean for cardiovascular risk.
It’s worth being honest about what we do and do not know here. If LDL cholesterol rises while your other markers stay in range, it is unclear whether that represents a meaningful increase in risk from LDL alone. Good metabolic markers may change how a lipid panel is interpreted, but they do not automatically erase risk.
Has insulin resistance improved? Dr. Scher looks at the markers that help assess metabolic health: insulin, glucose, A1c, triglycerides, HOMA-IR, LDL particle number and size, and ApoB. Blood pressure, visceral fat, and body composition add to that picture, along with any existing signs of vascular disease. Those changes help show whether someone’s overall risk profile is moving in a healthier direction, even when one lipid marker has moved the other way.
This is especially important because lowering LDL can reduce cardiovascular events, particularly in people at higher risk, but it doesn’t eliminate all sources of cardiovascular risk. Insulin resistance, poor glucose control, high blood pressure, excess visceral fat, and existing plaque still need attention.
The reverse is also true. Improving metabolic health can improve your cardiovascular risk substantially, but it does not reset prior risk to zero. If plaque has already developed, that remains part of your risk picture.
So when Dr. Scher evaluates cardiovascular risk, he’s not looking for one number to settle the question. He’s looking at how the lipid markers, metabolic health, family history, existing disease, and imaging findings fit together, along with the benefits and tradeoffs of the treatment someone is already using.
Dr. Scher covers the research behind this in more depth in How to Read Your Blood Panel and in his other videos on cholesterol and cardiovascular risk.
Put Your Numbers Into a Personal Risk Assessment
Once you’ve looked at LDL, triglycerides, HDL, and any additional markers such as ApoB or Lp(a), you still need to answer a bigger question: what do all of those numbers mean for your actual risk of cardiovascular disease?
That’s where a tool called PREVENT comes in. PREVENT stands for Predicting Risk of Cardiovascular Disease EVENTs, and the 2026 ACC/AHA dyslipidemia guidelines recommend using it to help guide prevention decisions in adults ages 30 to 79 who don’t already have cardiovascular disease.
Rather than looking at cholesterol in isolation, PREVENT combines your lipid results with factors such as age, blood pressure, kidney function, body mass index, smoking, and diabetes status to estimate your cardiovascular risk over time. However, diabetes is entered as a yes-or-no answer, and the standard calculation doesn’t directly account for prediabetes or insulin resistance — one reason your clinician may need to look beyond the calculator to understand your full metabolic risk.
In other words, an LDL of 130 mg/dL doesn’t go into the calculator and come back as “good” or “bad.” It becomes one component of a larger risk estimate for the person with that LDL.
Clinicians can also consider factors PREVENT doesn’t fully capture, such as family history and certain inflammatory conditions, and in some cases use coronary artery calcium testing to see whether the initial risk estimate should be adjusted.
Dr. Scher sees this as a more useful way to approach the numbers, while still emphasizing that a calculator can’t make the decision for you. PREVENT is built from population data, so the result still has to be interpreted alongside your health history, treatment goals, and any evidence of existing vascular disease.
The targets, according to the guidelines, are summarized below. These figures describe population-level recommendations and are not individualized treatment advice.
- Below 100 mg/dL for people at borderline or intermediate risk
- Below 70 mg/dL for people at high risk or with established cardiovascular disease
- Below 55 mg/dL for people at very high risk
Those targets are based on studies showing fewer cardiovascular events when LDL is lowered. Deciding how aggressively to pursue them is more individualized. How much benefit is someone likely to get from lowering LDL further? What medication would they need to get there? What side effects or added treatment burden could come with it? Is there already evidence of cardiovascular disease?
Those are the kinds of questions Dr. Scher believes should shape the decision with your care team.
For someone living with a psychiatric condition and using ketogenic therapy, there’s another part of that discussion: what’s the therapy currently doing for their mental health? If someone saw their LDL rise with ketogenic therapy, any change to the diet needs to be weighed against the benefits they are experiencing, as well as possible effects on medications, sleep, symptoms, and overall stability.
When Risk Estimates Don’t Tell the Whole Story
PREVENT and your metabolic health markers can help estimate cardiovascular risk, but they still leave one important question unanswered: is there already plaque in your arteries?
This is where vascular imaging can sometimes add another layer of information. As Dr. Scher puts it:
“LDL isn’t the disease. Vascular disease is.”
One option is a coronary artery calcium scan, a quick, non-contrast CT scan that looks for calcium in the coronary arteries. Calcium is a marker of existing atherosclerotic plaque, so the test can help show whether someone who appears borderline or intermediate risk on paper already has evidence of coronary artery disease.
The 2026 ACC/AHA guidelines include coronary calcium scoring as one way to refine risk when the answer is still uncertain. The data suggest the test is more informative in men over 40 and women over 45, since younger people are less likely to have developed enough calcified plaque for the scan to detect.
A coronary CT angiogram, or CCTA, can provide an even more detailed look at the coronary arteries, including plaque that has not yet calcified. Dr. Scher considers a coronary CT angiogram an even better way to look for vascular disease, though it is harder to get and is not included in the guidelines. It also comes with additional considerations such as contrast exposure, radiation, access, and cost.
Carotid intima-media thickness testing, or CIMT, is another option. It uses ultrasound to measure the thickness of the carotid artery wall, with no radiation or contrast involved. Which test makes sense, if any, is a decision for you and your clinician.
So if your LDL is elevated but the rest of your risk picture is less clear, the conversation may not have to stop with another estimate. Ask your clinician whether looking directly for evidence of vascular disease could help clarify your risk and guide what to do next.
Questions to Bring to Your Clinician
A flagged LDL result can raise a lot of questions, especially when ketogenic therapy is helping your mental health and other metabolic markers are improving.
Understanding what your results mean requires looking at your broader cardiovascular risk with your care team. Knowing what to ask can help you make the most of that conversation.
That’s why we created Making Sense of Your Cholesterol, a free guide that explains common lipid markers and how they fit into your bigger health picture. It also includes questions you can bring to your physician and an appointment checklist, so you can discuss your results and make informed decisions about what comes next.
For a deeper look at the science, watch How to Read Your Blood Panel with Dr. Bret Scher.
Medical disclaimer
Our channel is for informational purposes only. We are not providing individual or group medical or healthcare advice or establishing a provider-patient relationship. Many of the interventions we discuss can have potentially dangerous effects if done without proper supervision. Consult your healthcare provider before changing your lifestyle or medications. In addition, it is important to note that people may respond differently to ketosis, and there isn’t one recognized universal response.